
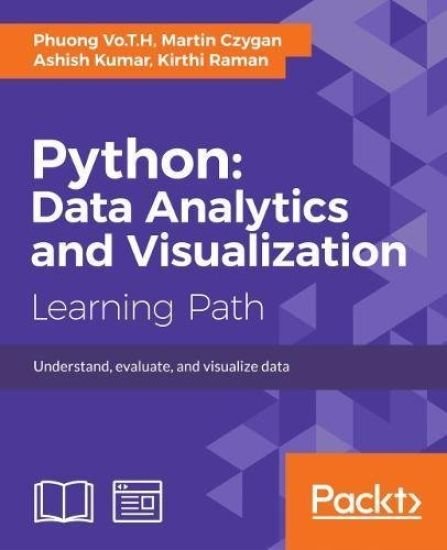
Python: Data Analytics and Visualization – hinnat ja saatavuus
Kirjafiili on kirjojen hintavertailu. Löydä halvin hinta 27 kirjakaupasta. Hintavertailu koskee ISBN-tunnusta 9781788290098 (nidottu).
Kirjan kuvaus
Understand, evaluate, and visualize data About This Book * Learn basic steps of data analysis and how to use Python and its packages * A step-by-step guide to predictive modeling including tips, tricks, and best practices * Effectively… Näytä koko kuvaus Piilota kuvaus
Understand, evaluate, and visualize data About This Book * Learn basic steps of data analysis and how to use Python and its packages * A step-by-step guide to predictive modeling including tips, tricks, and best practices * Effectively visualize a broad set of analyzed data and generate effective results Who This Book Is For This book is for Python Developers who are keen to get into data analysis and wish to visualize their analyzed data in a more efficient and insightful manner. What You Will Learn * Get acquainted with NumPy and use arrays and array-oriented computing in data analysis * Process and analyze data using the time-series capabilities of Pandas * Understand the statistical and mathematical concepts behind predictive analytics algorithms * Data visualization with Matplotlib * Interactive plotting with NumPy, Scipy, and MKL functions * Build financial models using Monte-Carlo simulations * Create directed graphs and multi-graphs * Advanced visualization with D3 In Detail You will start the course with an introduction to the principles of data analysis and supported libraries, along with NumPy basics for statistics and data processing. Next, you will overview the Pandas package and use its powerful features to solve data-processing problems. Moving on, you will get a brief overview of the Matplotlib API . Next, you will learn to manipulate time and data structures, and load and store data in a file or database using Python packages. You will learn how to apply powerful packages in Python to process raw data into pure and helpful data using examples. You will also get a brief overview of machine learning algorithms, that is, applying data analysis results to make decisions or building helpful products such as recommendations and predictions using Scikit-learn. After this, you will move on to a data analytics specialization-predictive analytics. Social media and IOT have resulted in an avalanche of data. You will get started with predictive analytics using Python. You will see how to create predictive models from data. You will get balanced information on statistical and mathematical concepts, and implement them in Python using libraries such as Pandas, scikit-learn, and NumPy. You'll learn more about the best predictive modeling algorithms such as Linear Regression, Decision Tree, and Logistic Regression. Finally, you will master best practices in predictive modeling. After this, you will get all the practical guidance you need to help you on the journey to effective data visualization. Starting with a chapter on data frameworks, which explains the transformation of data into information and eventually knowledge, this path subsequently cover the complete visualization process using the most popular Python libraries with working examples This Learning Path combines some of the best that Packt has to offer in one complete, curated package. It includes content from the following Packt products: ? Getting Started with Python Data Analysis, Phuong Vo. T. H &Martin Czygan ? Learning Predictive Analytics with Python, Ashish Kumar ? Mastering Python Data Visualization, Kirthi Raman Style and approach The course acts as a step-by-step guide to get you familiar with data analysis and the libraries supported by Python with the help of real-world examples and datasets. It also helps you gain practical insights into predictive modeling by implementing predictive-analytics algorithms on public datasets with Python. The course offers a wealth of practical guidance to help you on this journey to data visualization
Kirjan tiedot
Vertaa kirjan ”Python: Data Analytics and Visualization” hintoja
Vertaa tuotteen hintaa ja arvioitua kokonaishintaa toimitettuna. Kaikki hinnat koskevat ISBN-tunnusta 9781788290098.
Hintoja ei päivitetty automaattisesti. Voit hakea ajantasaiset hinnat painamalla Hae hinnat.

Booky

Suomalainen

Kansallinen Kirjakauppa

Prisma

Finlandia Kirja

Fantasiapelit

Vinhan kirjakauppa

CDON

Kustantamo S&S

Kennys.ie

Kristillinenkirjakauppa.fi

Sacrum

Adlibris

BookOutlet.fi

Kirja.fi

Rosebud
Tälle kirjalle ei ole tällä hetkellä vahvistettua hintaa. Tarkista tilanne myöhemmin uudelleen.
Hintoja ei ole vielä päivitetty.
Hälytys tallennettu!
Ilmoitamme, kun hinta laskee.
Saat sähköpostin, kun hinta laskee asettamaasi rajaan tai sen alle.
Python: Data Analytics and Visualization – hintahistoria
Seuraamme kirjan Python: Data Analytics and Visualization hintakehitystä kirjakaupoissa. Taulukosta näet viime kuukausien alimmat hinnat.
Alin hinta kauppoittain
Kunkin kaupan alin hinta viimeisten 90 päivän aikana.
Hintahistoriaa ei ole vielä kerätty tälle kirjalle.
Hinnat ilman toimituskuluja.