Kirjojen hintavertailu – 12 903 724 kirjaa ja 27 kauppaa
Kirjailija
Brian Everitt
Kirjat ja teokset yhdessä paikassa: 8 kirjaa, julkaisuja vuosilta 2001–2019, suosituimpiin kuuluu Analyzing Medical Data Using S-PLUS. Vertaile teosten hintoja ja tarkista saatavuus suomalaisista kirjakaupoista.
The book is intended as a quick source of reference and as an aide-memoir for students taking A-level, undergraduate or postgraduate statistics courses. It includes numerous examples, helping instructors on such courses by providing their students with small data sets with which to work.
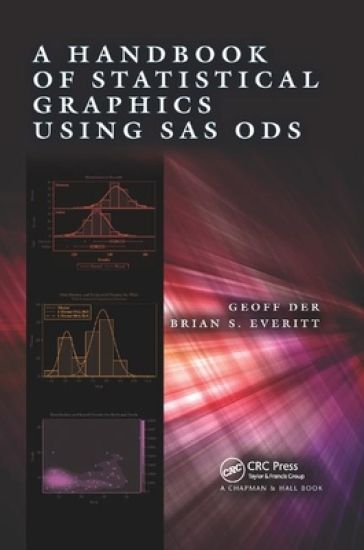
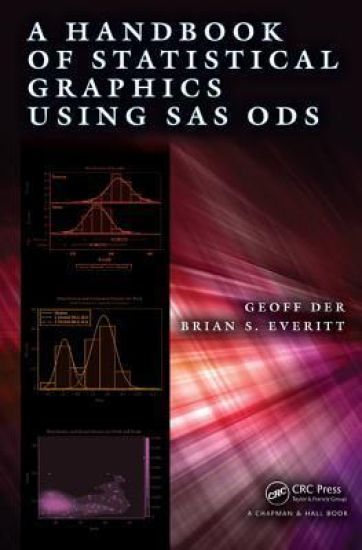
Easily Use SAS to Produce Your GraphicsDiagrams, plots, and other types of graphics are indispensable components in nearly all phases of statistical analysis, from the initial assessment of the data to the selection of appropriate statistical models to the diagnosis of the chosen models once they have been fitted to the data. Harnessing the full graphics capabilities of SAS, A Handbook of Statistical Graphics Using SAS ODS covers essential graphical methods needed in every statistician’s toolkit. It explains how to implement the methods using SAS 9.4. The handbook shows how to use SAS to create many types of statistical graphics for exploring data and diagnosing fitted models. It uses SAS’s newer ODS graphics throughout as this system offers a number of advantages, including ease of use, high quality of results, consistent appearance, and convenient semiautomatic graphs from the statistical procedures. Each chapter deals graphically with several sets of example data from a wide variety of areas, such as epidemiology, medicine, and psychology. These examples illustrate the use of graphic displays to give an overview of data, to suggest possible hypotheses for testing new data, and to interpret fitted statistical models. The SAS programs and data sets are available online.
Easily Use SAS to Produce Your GraphicsDiagrams, plots, and other types of graphics are indispensable components in nearly all phases of statistical analysis, from the initial assessment of the data to the selection of appropriate statistical models to the diagnosis of the chosen models once they have been fitted to the data. Harnessing the full graphics capabilities of SAS, A Handbook of Statistical Graphics Using SAS ODS covers essential graphical methods needed in every statistician’s toolkit. It explains how to implement the methods using SAS 9.4. The handbook shows how to use SAS to create many types of statistical graphics for exploring data and diagnosing fitted models. It uses SAS’s newer ODS graphics throughout as this system offers a number of advantages, including ease of use, high quality of results, consistent appearance, and convenient semiautomatic graphs from the statistical procedures. Each chapter deals graphically with several sets of example data from a wide variety of areas, such as epidemiology, medicine, and psychology. These examples illustrate the use of graphic displays to give an overview of data, to suggest possible hypotheses for testing new data, and to interpret fitted statistical models. The SAS programs and data sets are available online.
The book is intended as a quick source of reference and as an aide-memoir for students taking A-level, undergraduate or postgraduate statistics courses. It includes numerous examples, helping instructors on such courses by providing their students with small data sets with which to work.
The majority of data sets collected by researchers in all disciplines are multivariate, meaning that several measurements, observations, or recordings are taken on each of the units in the data set. These units might be human subjects, archaeological artifacts, countries, or a vast variety of other things. In a few cases, it may be sensible to isolate each variable and study it separately, but in most instances all the variables need to be examined simultaneously in order to fully grasp the structure and key features of the data. For this purpose, one or another method of multivariate analysis might be helpful, and it is with such methods that this book is largely concerned. Multivariate analysis includes methods both for describing and exploring such data and for making formal inferences about them. The aim of all the techniques is, in general sense, to display or extract the signal in the data in the presence of noise and to find out what the data show us in the midst of their apparent chaos. An Introduction to Applied Multivariate Analysis with R explores the correct application of these methods so as to extract as much information as possible from the data at hand, particularly as some type of graphical representation, via the R software. Throughout the book, the authors give many examples of R code used to apply the multivariate techniques to multivariate data.
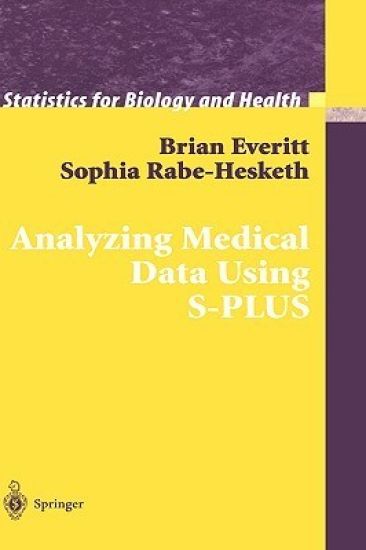
Each chapter will consist of basic statistical theory, simple examples of S-PLUS code, more complex examples of S-PLUS code, and exercises. All data sets will be taken from genuine medical investigations and will be made available, if possible, on a web site. All examples will contain extensive graphical analysis to highlight one of the prime features of S-PLUS. The book would complement Venables and Ripley (VR). However, there is far less about the details of S-PLUS and probably less technical descriptions of techniques. The book concentrates solely on medical data sets trying to demonstrate the flexibility of S-PLUS and its huge advantages, particularly for applied medical statisticians.
If you use statistics and need easy access to simple, reliable definitions and explanations of modern statistical concepts, then look no further than this dictionary. Over 3600 terms are defined, covering medical, survey, theoretical, and applied statistics, including computational aspects. Entries are provided for standard and specialized statistical software. In addition, short biographies of over 100 important statisticians are given. Definitions provide enough mathematical detail to clarify concepts and give standard formulae when these are helpful. The majority of definitions then give a reference to a book or article where the user can seek further or more specialized information, and many are accompanied by graphical material to aid understanding.
Each chapter will consist of basic statistical theory, simple examples of S-PLUS code, more complex examples of S-PLUS code, and exercises. All data sets will be taken from genuine medical investigations and will be made available, if possible, on a web site. All examples will contain extensive graphical analysis to highlight one of the prime features of S-PLUS. The book would complement Venables and Ripley (VR). However, there is far less about the details of S-PLUS and probably less technical descriptions of techniques. The book concentrates solely on medical data sets trying to demonstrate the flexibility of S-PLUS and its huge advantages, particularly for applied medical statisticians.