Kirjojen hintavertailu – 12 903 724 kirjaa ja 27 kauppaa

Kirjailija

Deborah Nolan

Kirjat ja teokset yhdessä paikassa: 9 kirjaa, julkaisuja vuosilta 2000–2023, suosituimpiin kuuluu Teaching Statistics. Vertaile teosten hintoja ja tarkista saatavuus suomalaisista kirjakaupoista.

9 kirjaa

Kirjojen julkaisuvuodet: 2000–2023.

Learning Data Science

Learning Data Science

Sam Lau; Joseph Gonzalez; Deborah Nolan

O'Reilly Media
2023
pokkari
As an aspiring data scientist, you appreciate why organizations rely on data for important decisions—whether it's for companies designing websites, cities deciding how to improve services, or scientists discovering how to stop the spread of disease. And you want the skills required to distill a messy pile of data into actionable insights. We call this the data science lifecycle: the process of collecting, wrangling, analyzing, and drawing conclusions from data. Learning Data Science is the first book to cover foundational skills in both programming and statistics that encompass this entire lifecycle. It's aimed at those who wish to become data scientists or who already work with data scientists, and at data analysts who wish to cross the "technical/nontechnical" divide. If you have a basic knowledge of Python programming, you'll learn how to work with data using industry-standard tools like pandas. Refine a question of interest to one that can be studied with data Pursue data collection that may involve text processing, web scraping, etc. Glean valuable insights about data through data cleaning, exploration, and visualization Learn how to use modeling to describe the data Generalize findings beyond the data
Communicating with Data

Communicating with Data

Deborah Nolan; Sara Stoudt

Oxford University Press
2021
nidottu
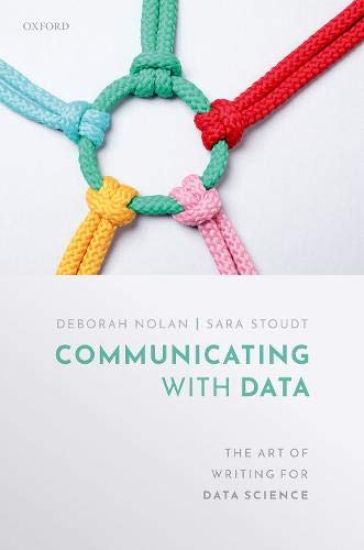
Communication is a critical yet often overlooked part of data science. Communicating with Data aims to help students and researchers write about their insights in a way that is both compelling and faithful to the data. General advice on science writing is also provided, including how to distill findings into a story and organize and revise the story, and how to write clearly, concisely, and precisely. This is an excellent resource for students who want to learn how to write about scientific findings, and for instructors who are teaching a science course in communication or a course with a writing component. Communicating with Data consists of five parts. Part I helps the novice learn to write by reading the work of others. Part II delves into the specifics of how to describe data at a level appropriate for publication, create informative and effective visualizations, and communicate an analysis pipeline through well-written, reproducible code. Part III demonstrates how to reduce a data analysis to a compelling story and organize and write the first draft of a technical paper. Part IV addresses revision; this includes advice on writing about statistical findings in a clear and accurate way, general writing advice, and strategies for proof reading and revising. Part V offers advice about communication strategies beyond the page, which include giving talks, building a professional network, and participating in online communities. This book also provides 22 portfolio prompts that extend the guidance and examples in the earlier parts of the book and help writers build their portfolio of data communication.
Communicating with Data

Communicating with Data

Deborah Nolan; Sara Stoudt

Oxford University Press
2021
sidottu
Communication is a critical yet often overlooked part of data science. Communicating with Data aims to help students and researchers write about their insights in a way that is both compelling and faithful to the data. General advice on science writing is also provided, including how to distill findings into a story and organize and revise the story, and how to write clearly, concisely, and precisely. This is an excellent resource for students who want to learn how to write about scientific findings, and for instructors who are teaching a science course in communication or a course with a writing component. Communicating with Data consists of five parts. Part I helps the novice learn to write by reading the work of others. Part II delves into the specifics of how to describe data at a level appropriate for publication, create informative and effective visualizations, and communicate an analysis pipeline through well-written, reproducible code. Part III demonstrates how to reduce a data analysis to a compelling story and organize and write the first draft of a technical paper. Part IV addresses revision; this includes advice on writing about statistical findings in a clear and accurate way, general writing advice, and strategies for proof reading and revising. Part V offers advice about communication strategies beyond the page, which include giving talks, building a professional network, and participating in online communities. This book also provides 22 portfolio prompts that extend the guidance and examples in the earlier parts of the book and help writers build their portfolio of data communication.
Data Science in R

Data Science in R

Deborah Nolan; Duncan Temple Lang

CRC Press
2017
sidottu
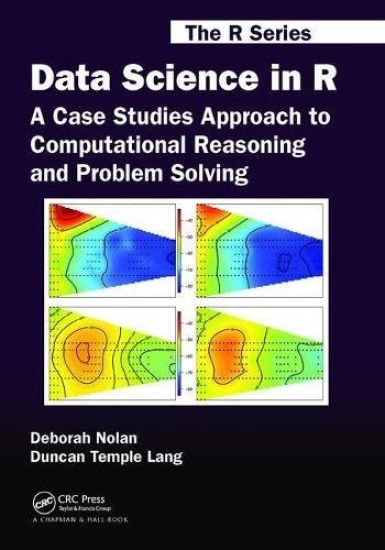
Effectively Access, Transform, Manipulate, Visualize, and Reason about Data and Computation Data Science in R: A Case Studies Approach to Computational Reasoning and Problem Solving illustrates the details involved in solving real computational problems encountered in data analysis. It reveals the dynamic and iterative process by which data analysts approach a problem and reason about different ways of implementing solutions. The book‘s collection of projects, comprehensive sample solutions, and follow-up exercises encompass practical topics pertaining to data processing, including: Non-standard, complex data formats, such as robot logs and email messages Text processing and regular expressions Newer technologies, such as Web scraping, Web services, Keyhole Markup Language (KML), and Google Earth Statistical methods, such as classification trees, k-nearest neighbors, and na Bayes Visualization and exploratory data analysis Relational databases and Structured Query Language (SQL) Simulation Algorithm implementation Large data and efficiency Suitable for self-study or as supplementary reading in a statistical computing course, the book enables instructors to incorporate interesting problems into their courses so that students gain valuable experience and data science skills. Students learn how to acquire and work with unstructured or semistructured data as well as how to narrow down and carefully frame the questions of interest about the data. Blending computational details with statistical and data analysis concepts, this book provides readers with an understanding of how professional data scientists think about daily computational tasks. It will improve readers computational reasoning of real-world data analyses.
Teaching Statistics

Teaching Statistics

Andrew Gelman; Deborah Nolan

Oxford University Press
2017
sidottu
Students in the sciences, economics, social sciences, and medicine take an introductory statistics course. And yet statistics can be notoriously difficult for instructors to teach and for students to learn. To help overcome these challenges, Gelman and Nolan have put together this fascinating and thought-provoking book. Based on years of teaching experience the book provides a wealth of demonstrations, activities, examples, and projects that involve active student participation. Part I of the book presents a large selection of activities for introductory statistics courses and has chapters such as 'First week of class'-- with exercises to break the ice and get students talking; then descriptive statistics, graphics, linear regression, data collection (sampling and experimentation), probability, inference, and statistical communication. Part II gives tips on what works and what doesn't, how to set up effective demonstrations, how to encourage students to participate in class and to work effectively in group projects. Course plans for introductory statistics, statistics for social scientists, and communication and graphics are provided. Part III presents material for more advanced courses on topics such as decision theory, Bayesian statistics, sampling, and data science.
Teaching Statistics

Teaching Statistics

Andrew Gelman; Deborah Nolan

Oxford University Press
2017
nidottu
Students in the sciences, economics, social sciences, and medicine take an introductory statistics course. And yet statistics can be notoriously difficult for instructors to teach and for students to learn. To help overcome these challenges, Gelman and Nolan have put together this fascinating and thought-provoking book. Based on years of teaching experience the book provides a wealth of demonstrations, activities, examples, and projects that involve active student participation. Part I of the book presents a large selection of activities for introductory statistics courses and has chapters such as 'First week of class'-- with exercises to break the ice and get students talking; then descriptive statistics, graphics, linear regression, data collection (sampling and experimentation), probability, inference, and statistical communication. Part II gives tips on what works and what doesn't, how to set up effective demonstrations, how to encourage students to participate in class and to work effectively in group projects. Course plans for introductory statistics, statistics for social scientists, and communication and graphics are provided. Part III presents material for more advanced courses on topics such as decision theory, Bayesian statistics, sampling, and data science.
Data Science in R

Data Science in R

Deborah Nolan; Duncan Temple Lang

Apple Academic Press Inc.
2015
nidottu
Effectively Access, Transform, Manipulate, Visualize, and Reason about Data and ComputationData Science in R: A Case Studies Approach to Computational Reasoning and Problem Solving illustrates the details involved in solving real computational problems encountered in data analysis. It reveals the dynamic and iterative process by which data analysts approach a problem and reason about different ways of implementing solutions. The book’s collection of projects, comprehensive sample solutions, and follow-up exercises encompass practical topics pertaining to data processing, including: Non-standard, complex data formats, such as robot logs and email messagesText processing and regular expressionsNewer technologies, such as Web scraping, Web services, Keyhole Markup Language (KML), and Google EarthStatistical methods, such as classification trees, k-nearest neighbors, and naïve BayesVisualization and exploratory data analysisRelational databases and Structured Query Language (SQL)SimulationAlgorithm implementationLarge data and efficiencySuitable for self-study or as supplementary reading in a statistical computing course, the book enables instructors to incorporate interesting problems into their courses so that students gain valuable experience and data science skills. Students learn how to acquire and work with unstructured or semistructured data as well as how to narrow down and carefully frame the questions of interest about the data. Blending computational details with statistical and data analysis concepts, this book provides readers with an understanding of how professional data scientists think about daily computational tasks. It will improve readers’ computational reasoning of real-world data analyses.
XML and Web Technologies for Data Sciences with R

XML and Web Technologies for Data Sciences with R

Deborah Nolan; Duncan Temple Lang

Springer-Verlag New York Inc.
2013
nidottu
Web technologies are increasingly relevant to scientists working with data, for both accessing data and creating rich dynamic and interactive displays. The XML and JSON data formats are widely used in Web services, regular Web pages and JavaScript code, and visualization formats such as SVG and KML for Google Earth and Google Maps. In addition, scientists use HTTP and other network protocols to scrape data from Web pages, access REST and SOAP Web Services, and interact with NoSQL databases and text search applications. This book provides a practical hands-on introduction to these technologies, including high-level functions the authors have developed for data scientists. It describes strategies and approaches for extracting data from HTML, XML, and JSON formats and how to programmatically access data from the Web. Along with these general skills, the authors illustrate several applications that are relevant to data scientists, such as reading and writing spreadsheet documents both locally and via Google Docs, creating interactive and dynamic visualizations, displaying spatial-temporal displays with Google Earth, and generating code from descriptions of data structures to read and write data. These topics demonstrate the rich possibilities and opportunities to do new things with these modern technologies. The book contains many examples and case-studies that readers can use directly and adapt to their own work. The authors have focused on the integration of these technologies with the R statistical computing environment. However, the ideas and skills presented here are more general, and statisticians who use other computing environments will also find them relevant to their work. Deborah Nolan is Professor of Statistics at University of California, Berkeley. Duncan Temple Lang is Associate Professor of Statistics at University of California, Davis and has been a member of both the S and R development teams.
Stat Labs

Stat Labs

Deborah Nolan; Terry P. Speed

Springer-Verlag New York Inc.
2000
nidottu
This book uses a model we have developed for teaching mathematical statistics through in depth case studies. Traditional statistics texts have many small numer ical examples in each chapter to illustrate a topic in statistical theory. Here, we instead make a case study the centerpiece of each chapter. The case studies, which we call labs, raise interesting scienti?c questions, and ?guring out how to answer a question is the starting point for developing statistical theory. The labs are substan tial exercises; they have nontrivial solutions that leave room for different analyses of the data. In addition to providing the framework and motivation for studying topics in mathematical statistics, the labs help students develop statistical thinking. We feel that this approach integrates theoretical and applied statistics in a way not commonly encountered in an undergraduate text. The Student The book is intended for a course in mathematical statistics for juniors and seniors. We assume that students have had one year of calculus, including Taylor series, and a course in probability. We do not assume students have experience with statistical software so we incorporate lessons into our course on how to use the software.