Kirjojen hintavertailu – 12 903 724 kirjaa ja 27 kauppaa
Kirjailija
Dmitry Anoshin
Kirjat ja teokset yhdessä paikassa: 10 kirjaa, julkaisuja vuosilta 2015–2026, suosituimpiin kuuluu Data Engineering with Azure Databricks. Vertaile teosten hintoja ja tarkista saatavuus suomalaisista kirjakaupoista.
Master end-to-end data engineering on Azure Databricks. From data ingestion and Delta Lake to CI/CD and real-time streaming, build secure, scalable, and performant data solutions with Spark, Unity Catalog, and ML tools. Key Features Build scalable data pipelines using Apache Spark and Delta Lake Automate workflows and manage data governance with Unity Catalog Learn real-time processing and structured streaming with practical use cases Implement CI/CD, DevOps, and security for production-ready data solutions Explore Databricks-native ML, AutoML, and Generative AI integration Book Description"Data Engineering with Azure Databricks" is your essential guide to building scalable, secure, and high-performing data pipelines using the powerful Databricks platform on Azure. Designed for data engineers, architects, and developers, this book demystifies the complexities of Spark-based workloads, Delta Lake, Unity Catalog, and real-time data processing. Beginning with the foundational role of Azure Databricks in modern data engineering, you’ll explore how to set up robust environments, manage data ingestion with Auto Loader, optimize Spark performance, and orchestrate complex workflows using tools like Azure Data Factory and Airflow. The book offers deep dives into structured streaming, Delta Live Tables, and Delta Lake’s ACID features for data reliability and schema evolution. You’ll also learn how to manage security, compliance, and access controls using Unity Catalog, and gain insights into managing CI/CD pipelines with Azure DevOps and Terraform. With a special focus on machine learning and generative AI, the final chapters guide you in automating model workflows, leveraging MLflow, and fine-tuning large language models on Databricks. Whether you're building a modern data lakehouse or operationalizing analytics at scale, this book provides the tools and insights you need. What you will learn Set up a full-featured Azure Databricks environment Implement batch and streaming ingestion using Auto Loader Optimize Spark jobs with partitioning and caching Build real-time pipelines with structured streaming and DLT Manage data governance using Unity Catalog Orchestrate production workflows with jobs and ADF Apply CI/CD best practices with Azure DevOps and Git Secure data with RBAC, encryption, and compliance standards Use MLflow and Feature Store for ML pipelines Build generative AI applications in Databricks Who this book is forThis book is for data engineers, solution architects, cloud professionals, and software engineers seeking to build robust and scalable data pipelines using Azure Databricks. Whether you're migrating legacy systems, implementing a modern lakehouse architecture, or optimizing data workflows for performance, this guide will help you leverage the full power of Databricks on Azure. A basic understanding of Python, Spark, and cloud infrastructure is recommended.
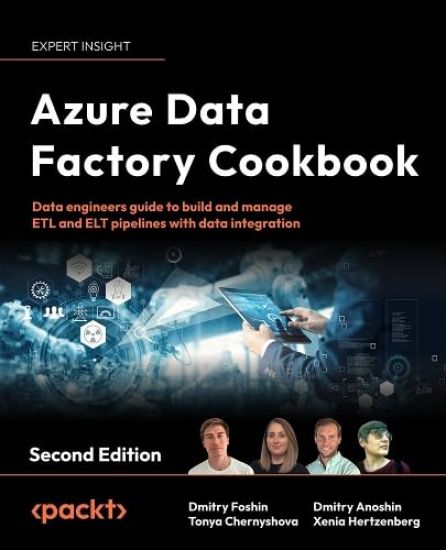
Data Engineers guide to solve real-world problems encountered while building and transforming data pipelines using Azure's data integration tool Key Features Solve real-world data problems and create data-driven workflows with ease using Azure Data Factory Build an ADF pipeline that operates on pre-built ML model and Azure AI Get up and running with Fabric Data Explorer and extend ADF with Logic Apps and Azure functions Book DescriptionThis new edition of the Azure Data Factory book, fully updated to reflect ADS V2, will help you get up and running by showing you how to create and execute your first job in ADF. There are updated and new recipes throughout the book based on developments happening in Azure Synapse, Deployment with Azure DevOps, and Azure Purview. The current edition also runs you through Fabric Data Factory, Data Explorer, and some industry-grade best practices with specific chapters on each. You’ll learn how to branch and chain activities, create custom activities, and schedule pipelines, as well as discover the benefits of cloud data warehousing, Azure Synapse Analytics, and Azure Data Lake Gen2 Storage. With practical recipes, you’ll learn how to actively engage with analytical tools from Azure Data Services and leverage your on-premises infrastructure with cloud-native tools to get relevant business insights. You'll familiarize yourself with the common errors that you may encounter while working with ADF and find out the solutions to them. You’ll also understand error messages and resolve problems in connectors and data flows with the debugging capabilities of ADF. By the end of this book, you’ll be able to use ADF with its latest advancements as the main ETL and orchestration tool for your data warehouse projects. What you will learn Build and Manage data pipelines with ease using the latest version of ADF Configure, load data, and operate data flows with Azure Synapse Get up and running with Fabric Data Factory Working with Azure Data Factory and Azure Purview Create big data pipelines using Databricks and Delta tables Integrate ADF with commonly used Azure services such as Azure ML, Azure Logic Apps, and Azure Functions Learn industry-grade best practices for using Azure Data Factory Who this book is forThis book is for ETL developers, data warehouse and ETL architects, software professionals, and anyone else who wants to learn about the common and not-so-common challenges faced while developing traditional and hybrid ETL solutions using Microsoft's Azure Data Factory. You’ll also find this book useful if you are looking for recipes to improve or enhance your existing ETL pipelines. Basic knowledge of data warehousing is a prerequisite.
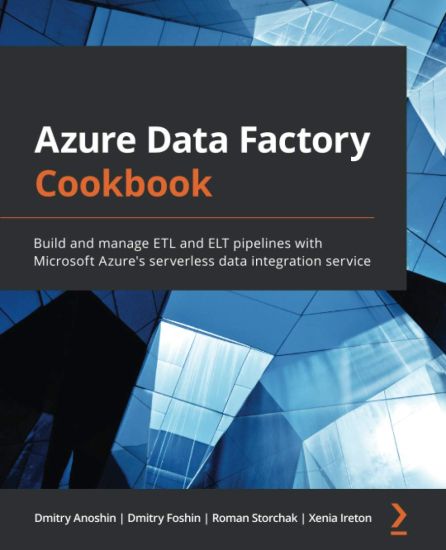
Solve real-world data problems and create data-driven workflows for easy data movement and processing at scale with Azure Data FactoryKey FeaturesLearn how to load and transform data from various sources, both on-premises and on cloudUse Azure Data Factory’s visual environment to build and manage hybrid ETL pipelinesDiscover how to prepare, transform, process, and enrich data to generate key insightsBook DescriptionAzure Data Factory (ADF) is a modern data integration tool available on Microsoft Azure. This Azure Data Factory Cookbook helps you get up and running by showing you how to create and execute your first job in ADF. You’ll learn how to branch and chain activities, create custom activities, and schedule pipelines. This book will help you to discover the benefits of cloud data warehousing, Azure Synapse Analytics, and Azure Data Lake Gen2 Storage, which are frequently used for big data analytics. With practical recipes, you’ll learn how to actively engage with analytical tools from Azure Data Services and leverage your on-premise infrastructure with cloud-native tools to get relevant business insights. As you advance, you’ll be able to integrate the most commonly used Azure Services into ADF and understand how Azure services can be useful in designing ETL pipelines. The book will take you through the common errors that you may encounter while working with ADF and show you how to use the Azure portal to monitor pipelines. You’ll also understand error messages and resolve problems in connectors and data flows with the debugging capabilities of ADF. By the end of this book, you’ll be able to use ADF as the main ETL and orchestration tool for your data warehouse or data platform projects. What you will learnCreate an orchestration and transformation job in ADFDevelop, execute, and monitor data flows using Azure SynapseCreate big data pipelines using Azure Data Lake and ADFBuild a machine learning app with Apache Spark and ADFMigrate on-premises SSIS jobs to ADFIntegrate ADF with commonly used Azure services such as Azure ML, Azure Logic Apps, and Azure FunctionsRun big data compute jobs within HDInsight and Azure DatabricksCopy data from AWS S3 and Google Cloud Storage to Azure Storage using ADF's built-in connectorsWho this book is forThis book is for ETL developers, data warehouse and ETL architects, software professionals, and anyone who wants to learn about the common and not-so-common challenges faced while developing traditional and hybrid ETL solutions using Microsoft's Azure Data Factory. You’ll also find this book useful if you are looking for recipes to improve or enhance your existing ETL pipelines. Basic knowledge of data warehousing is expected.
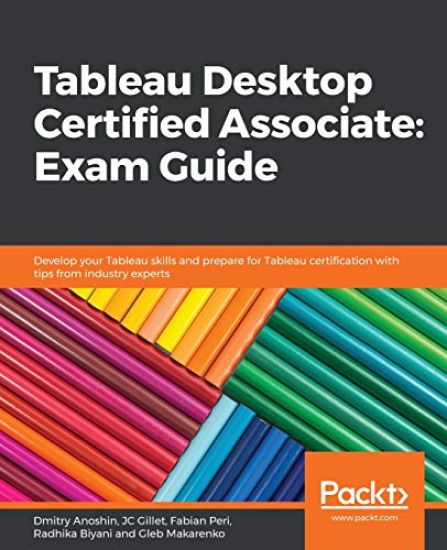
Learn through hands-on exercises covering a variety of topics including data connections, analytics, and dashboards to effectively prepare for the Tableau Desktop Certified Associate examKey FeaturesPrepare for the Tableau Desktop Certified Associate exam with the help of tips and techniques shared by expertsImplement Tableau’s advanced analytical capabilities such as forecastingDelve into advanced Tableau features and explore best practices for building dashboardsBook DescriptionThe Tableau Desktop Certified Associate exam measures your knowledge of Tableau Desktop and your ability to work with data and data visualization techniques. This book will help you to become well-versed in Tableau software and use its business intelligence (BI) features to solve BI and analytics challenges. With the help of this book, you'll explore the authors' success stories and their experience with Tableau. You'll start by understanding the importance of Tableau certification and the different certification exams, along with covering the exam format, Tableau basics, and best practices for preparing data for analysis and visualization. The book builds on your knowledge of advanced Tableau topics such as table calculations for solving problems. You'll learn to effectively visualize geographic data using vector maps. Later, you'll discover the analytics capabilities of Tableau by learning how to use features such as forecasting. Finally, you'll understand how to build and customize dashboards, while ensuring they convey information effectively. Every chapter has examples and tests to reinforce your learning, along with mock tests in the last section. By the end of this book, you'll be able to efficiently prepare for the certification exam with the help of mock tests, detailed explanations, and expert advice from the authors. What you will learnApply Tableau best practices to analyze and visualize dataUse Tableau to visualize geographic data using vector mapsCreate charts to gain productive insights into data and make quality-driven decisionsImplement advanced analytics techniques to identify and forecast key valuesPrepare customized table calculations to compute specific valuesAnswer questions based on the Tableau Desktop Certified Associate exam with the help of mock testsWho this book is forThis Tableau certification book is for business analysts, BI professionals, and data analysts who want to become certified Tableau Desktop Associates and solve a range of data science and business intelligence problems using this example-packed guide. Some experience in Tableau Desktop is expected to get the most out of this book.
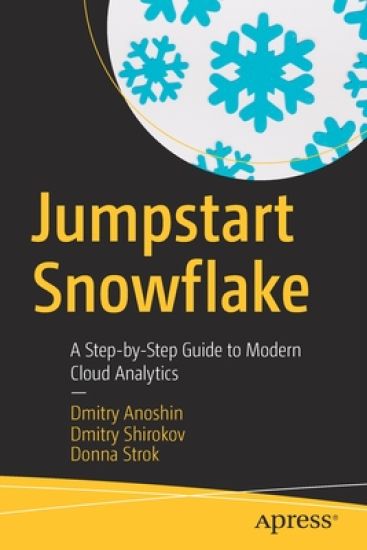
Explore the modern market of data analytics platforms and the benefits of using Snowflake computing, the data warehouse built for the cloud. With the rise of cloud technologies, organizations prefer to deploy their analytics using cloud providers such as Amazon Web Services (AWS), Microsoft Azure, or Google Cloud Platform. Cloud vendors are offering modern data platforms for building cloud analytics solutions to collect data and consolidate into single storage solutions that provide insights for business users. The core of any analytics framework is the data warehouse, and previously customers did not have many choices of platform to use. Snowflake was built specifically for the cloud and it is a true game changer for the analytics market. This book will help onboard you to Snowflake, present best practices to deploy, and use the Snowflake data warehouse. In addition, it covers modern analytics architecture and use cases. It provides use cases of integration with leading analytics software such as Matillion ETL, Tableau, and Databricks. Finally, it covers migration scenarios for on-premise legacy data warehouses. What You Will Learn Know the key functionalities of SnowflakeSet up security and access with clusterBulk load data into Snowflake using the COPY commandMigrate from a legacy data warehouse to Snowflakeintegrate the Snowflake data platform with modern business intelligence (BI) and data integration tools Who This Book Is For Those working with data warehouse and business intelligence (BI) technologies, and existing and potential Snowflake users
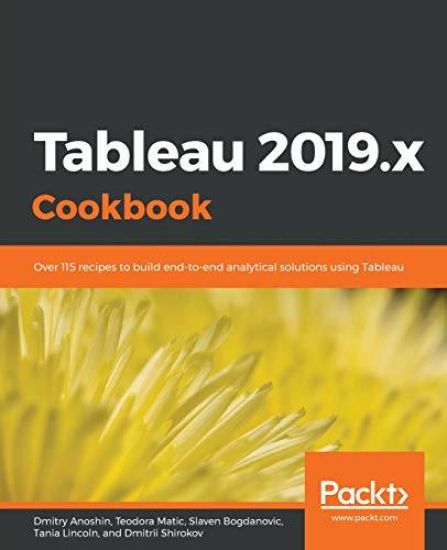
Perform advanced dashboard, visualization, and analytical techniques with Tableau Desktop, Tableau Prep, and Tableau ServerKey FeaturesUnique problem-solution approach to aid effective business decision-makingCreate interactive dashboards and implement powerful business intelligence solutionsIncludes best practices on using Tableau with modern cloud analytics servicesBook DescriptionTableau has been one of the most popular business intelligence solutions in recent times, thanks to its powerful and interactive data visualization capabilities. Tableau 2019.x Cookbook is full of useful recipes from industry experts, who will help you master Tableau skills and learn each aspect of Tableau's ecosystem. This book is enriched with features such as Tableau extracts, Tableau advanced calculations, geospatial analysis, and building dashboards. It will guide you with exciting data manipulation, storytelling, advanced filtering, expert visualization, and forecasting techniques using real-world examples. From basic functionalities of Tableau to complex deployment on Linux, you will cover it all. Moreover, you will learn advanced features of Tableau using R, Python, and various APIs. You will learn how to prepare data for analysis using the latest Tableau Prep. In the concluding chapters, you will learn how Tableau fits the modern world of analytics and works with modern data platforms such as Snowflake and Redshift. In addition, you will learn about the best practices of integrating Tableau with ETL using Matillion ETL. By the end of the book, you will be ready to tackle business intelligence challenges using Tableau's features. What you will learnUnderstand the basic and advanced skills of Tableau DesktopImplement best practices of visualization, dashboard, and storytellingLearn advanced analytics with the use of build in statisticsDeploy the multi-node server on Linux and WindowsUse Tableau with big data sources such as Hadoop, Athena, and SpectrumCover Tableau built-in functions for forecasting using R packagesCombine, shape, and clean data for analysis using Tableau PrepExtend Tableau’s functionalities with REST API and R/PythonWho this book is forTableau 2019.x Cookbook is for data analysts, data engineers, BI developers, and users who are looking for quick solutions to common and not-so-common problems faced while using Tableau products. Put each recipe into practice by bringing the latest offerings of Tableau 2019.x to solve real-world analytics and business intelligence challenges. Some understanding of BI concepts and Tableau is required.
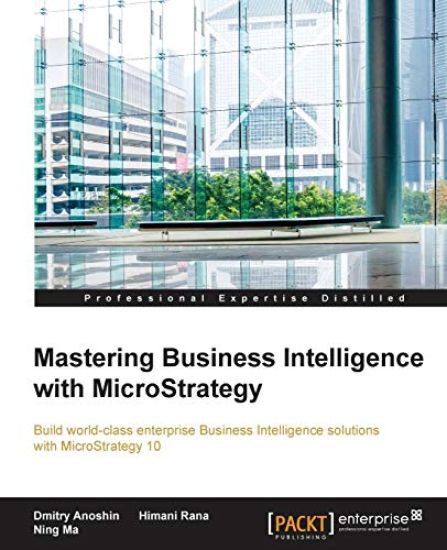
Build world-class enterprise Business Intelligence solutions with MicroStrategy 10 About This Book • Fix the gap between BI tools and implementation/integration processes with big data and predictive analytics using this comprehensive guide to MicroStrategy 10 • Highly practical, example-rich guide that lets you implement business intelligence with MicroStrategy 10 in your organization • Create the best user experience with BI dashboards using MicroStrategy using this up-to-date, comprehensive guide Who This Book Is For This book is intended for BI, DWH, ETL developers, BI/DWH/Analytics managers, analysts, and business users who already have MicroStrategy in their organization and want to take it to the next level in order to increase performance and improve user experience. In addition, it helps the reader to migrate from MicroStrategy 9 to MicroStrategy 10 and to start using the new capabilities. What You Will Learn • Explore various visualization techniques for presenting analyzed data • Customize MicroStrategy in order to meet your business requirements • Develop and design mobile dashboards • Use the advanced techniques such as designing reports, documents and interactive dashboards for building dashboards • Understand the concepts of data discovery and Desktop capabilities • Explore the best practices for Microstrategy system administration • Find and fix issues based on connections, environment or documents • Integrate third party ESRI map tools with MicroStrategy to create geo based reports In Detail Business intelligence is becoming more important by the day, with cloud offerings and mobile devices gaining wider acceptance and achieving better market penetration. MicroStrategy Reporting Suite is an absolute leader in the BI market and offers rich capabilities from basic data visualizations to predictive analytics. It lets you various delivery methods such as the Web, desktops, and mobiles. Using real-world BI scenarios, this book helps you to implement Business Analytics solutions in big e-commerce companies. It kicks off with MicroStrategy 10 features and then covers schema design models and techniques. Building upon your existing knowledge, the book will teach you advanced techniques for building documents and dashboards. It further teaches various graphical techniques for presenting data for analysis using maps, graphs, and advanced charts. Although MicroStrategy has rich functionality, the book will show how to customize it in order to meet your business requirements. You will also become familiar with the native analytical functions that will help you to maximize the impact of BI solutions with powerful predictive analytics. Furthermore, the book will focus on MicroStrategy Mobile Analytics along with data discovery and desktop capabilities such as connecting various data sources and building interactive dashboards. The book will also uncover best practices, troubleshooting techniques for MicroStrategy system administration, and also security and authentication techniques. Lastly, you will learn to use Hadoop for MicroStrategy reporting. By the end of the book, you will become proficient in evaluating any BI software in order to choose the best one that meets all business requirements. Style and approach This book will be focusing on providing extensive guide to plan how to design and develop complex BI architecture for real world scenario, using Microstrategy 10, best practices and collected experience working with BI, predictive analytics, and Microstrategy and big data.
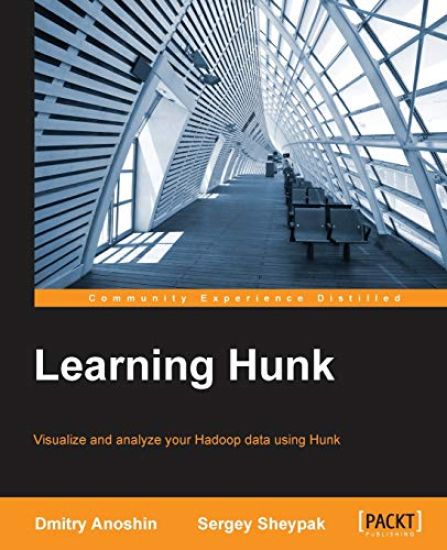
Visualize and analyze your Hadoop data using Hunk About This Book • Explore your data in Hadoop and NoSQL data stores • Create and optimize your reporting experience with advanced data visualizations and data analytics • A comprehensive developer's guide that helps you create outstanding analytical solutions efficiently Who This Book Is For If you are Hadoop developers who want to build efficient real-time Operation Intelligence Solutions based on Hadoop deployments or various NoSQL data stores using Hunk, this book is for you. Some familiarity with Splunk is assumed. What You Will Learn • Deploy and configure Hunk on top of Cloudera Hadoop • Create and configure Virtual Indexes for datasets • Make your data presentable using the wide variety of data visualization components and knowledge objects • Design a data model using Hunk best practices • Add more flexibility to your analytics solution via extended SDK and custom visualizations • Discover data using MongoDB as a data source • Integrate Hunk with AWS Elastic MapReduce to improve scalability In Detail Hunk is the big data analytics platform that lets you rapidly explore, analyse, and visualize data in Hadoop and NoSQL data stores. It provides a single, fluid user experience, designed to show you insights from your big data without the need for specialized skills, fixed schemas, or months of development. Hunk goes beyond typical data analysis methods and gives you the power to rapidly detect patterns and find anomalies across petabytes of raw data. This book focuses on exploring, analysing, and visualizing big data in Hadoop and NoSQL data stores with this powerful full-featured big data analytics platform. You will begin by learning the Hunk architecture and Hunk Virtual Index before moving on to how to easily analyze and visualize data using Splunk Search Language (SPL). Next you will meet Hunk Apps which can easy integrate with NoSQL data stores such as MongoDB or Sqqrl. You will also discover Hunk knowledge objects, build a semantic layer on top of Hadoop, and explore data using the friendly user-interface of Hunk Pivot. You will connect MongoDB and explore data in the data store. Finally, you will go through report acceleration techniques and analyze data in the AWS Cloud. Style and approach A step-by-step guide starting right from the basics and deep diving into the more advanced and technical aspects of Hunk.
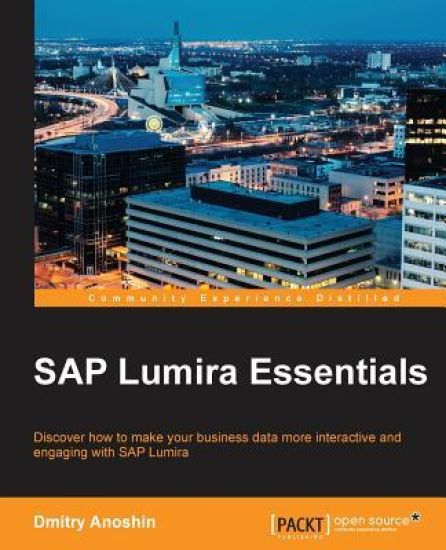
Discover how to make your business data more interactive and engaging with SAP Lumira About This Book • Create a powerful data discovery experience with the advanced capabilities of SAP Lumira • Find business insights in your data through data blending, wrangling, transformation, and visualization • A fast-paced guide packed with hands-on practical examples, real-world solutions, and best practices to get you started with SAP Lumira Who This Book Is For If you are a SAP user, business analyst, BI developer, or a junior data engineer who wants to use SAP Lumira to build creative visualizations, this book is for you. You should have a reasonable level of knowledge of SAP Business Objects and its components. What You Will Learn • Deploy SAP Lumira on your computer and learn more about the SAP Lumira interface • Extract data from different sources using SAP Lumira's data connecters • Prepare, filter, clean, and format your data • Discover visualization techniques and data discovery methods • Administrate and customize SAP Lumira to get basic knowledge of its SDK • Create various charts to deliver fantastic data visualizations • Connect to SAP BusinessObjects BI Platform and SAP HANA to extract, prepare, and visualize data In Detail SAP Lumira allows you to combine data from multiple sources into a single view and create engaging visualizations quickly and easily. It is a reporting platform that helps users access data and independently perform analysis. With the increasing interest in data discovery, self-service BI, and visualization around the world, tools like SAP Lumira help to eliminate the complexities of analyzing and discovering data. Learn data discovery techniques, build amazing visualizations, create fantastic stories, and share your visualizations through an electronic medium with one of the most powerful tools around—SAP Lumira. You will begin with an overview of the SAP Lumira family of products. You will then go through various data discovery techniques using real-world scenarios of an online e-commerce retailer through detailed recipes on the installation, administration, and customization of SAP Lumira. Next, you will work with data, starting from acquiring data from various data sources, then preparing and visualizing it using the rich functionality of SAP Lumira. Finally, you will present data via a data story or infographic and publish it across your organization or on the World Wide Web. Style and approach This is a step-by-step guide to learning SAP Lumira essentials packed with examples on real-world problems and solutions.