Kirjojen hintavertailu – 12 859 819 kirjaa ja 27 kauppaa
Kirjailija
Gary T. Henry
Kirjat ja teokset yhdessä paikassa: 6 kirjaa, julkaisuja vuosilta 1990–2019, suosituimpiin kuuluu Diligently Seeking God. Vertaile teosten hintoja ja tarkista saatavuus suomalaisista kirjakaupoista.
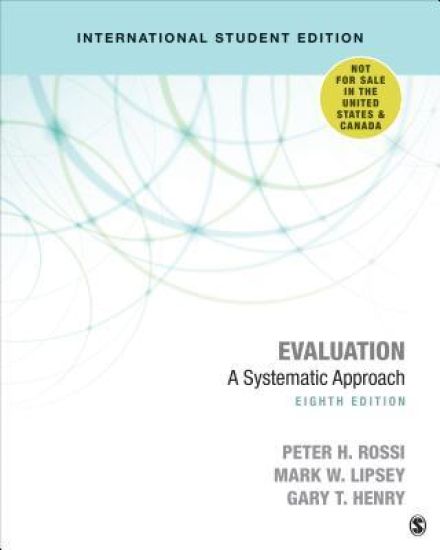
Evaluation: A Systematic Approach is the bestselling comprehensive introduction to the field of programme evaluation, covering the range of evaluation research activities used in appraising the design, implementation, effectiveness and efficiency of social programmes. This Eighth Edition includes a new practical chapter on planning an evaluation.
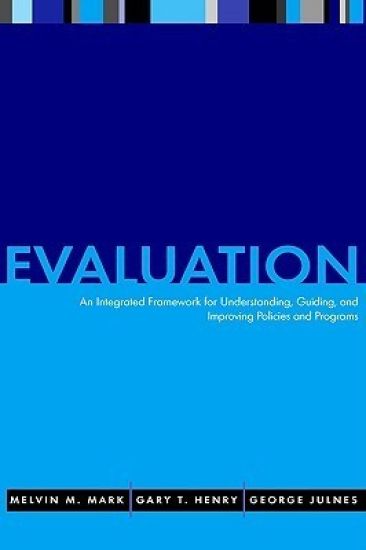
"This is one of the most coherent and comprehensive theories of evaluation yet formulated and one that makes a most valuable contribution. The authors are pioneering in important new directions."--Ernest R. House, author of Professional Evaluation and Evaluating with Validity "This book is the best I've ever read detailing a practical theory of evaluation. It is comprehensive, beautifully written, and makes sense of the evaluation enterprise. It does so by emphasizing the major function of evaluation as sense-making about policies and programs."--Thomas D. Cook, professor, sociology, psychology, education, and public policy, Northwestern UniversityPrograms that serve the needs of the public continually face changes brought by social, political, and economic forces. To survive these changes, organizations must evaluate their programs wisely and realistically. This book offers a new approach to evaluation, one that will encourage all kinds of organizations and agencies to improve their contributions to social betterment. The authors draw from three decades of evaluation practice and theory to present their own framework for conceptualizing evaluation and for pragmatically assessing social policies and programs. They analyze four purposes of evaluation:*To review the merit of programs and their value to society*To improve the organization and its services*To ensure program compliance with mandates*To build knowledge and expertise for future programsFor the practitioner, these purposes help define the approach and methods for an evaluation. The authors also enrich their discussion with four possible modes of inquiry: description, classification, causal analysis, and values inquiry. Filled with tables, charts, and figures, this resource invites organizations to make the most appropriate programming decisions based on thoughtful and systematic methods. Evaluation: An Integrated Framework for Understanding, Guiding, and Improving Policies and Programs is a tool that scholars can use to rejuvenate their view of evaluation and that practitioners can use to integrate the best techniques with a contemporary understanding of social policy and change.
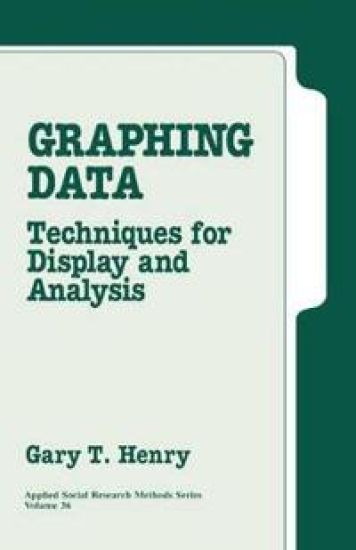
How can applied researchers present and analyze their research data more effectively? By applying the techniques described in this volume, social scientists will be able to make the most efficient use of their data as well as making it more accessible. The book uses many examples to illustrate effective graphical displays of data and offers practical techniques for producing graphs. Beginning with a discussion of what has been learned from visual perception research that relates to graphing data, the book then covers: the use of graphs for summarizing data; the display of multiple units; ways to improve tabular displays; graphical alternatives to tables; two variable scatterplots as graphical support for correlation and regression; how to show variation and the summary statistics together; and how to create more effective legends and titles on a graphical display.
Gary Henry has provided an excellent little book which discusses not only the basic 'techniques for display and analysis' which are available, but offers some very timely hints for their effective use. His audience is the 'applied researcher'. . . anybody engaged in empirical research at all. . . . He does. . . provide empirically grounded and valuable advice throughout on how best to design effective, accurate and reliable displays. . . . he provides a theoretical framework to guide the design of competent graphical displays. . . . Graphing Data. . . is well worth a good read. --Randy Banks in ESRC Data Archive Bulletin "Graphing Data is an accurate and factual presentation of effective techniques for graphically displaying quantitative data. The ideas postulated within the book represent effective techniques for graphing quantitative data and are consistent with the ideas of contemporary authors about the visual display of quantitative information. Graphing Data provides guidelines for researchers with desktop publishing capability who desire to incorporate graphs displaying quantitative data into research and evaluation reports. . . . The book is worthy of consideration as a course text for the introduction to graphing data or as a supplementary text for an introductory course on statistics where communicating research results are discussed. . . . Graphing Data serves as a legitimate reference for selecting appropriate data displays depending on the type of data and the purpose of data. . . . I would recommend this book for researchers and scholars interested in the effective communication of quantitative data to broad audiences." --Robert C. Branch in a prepublication review for Evaluation and Program Planning How can applied researchers present and analyze their research data more effectively? By using the techniques described in this volume, social scientists will be able to make their data more accessible to nontechnical audiences. This book is packed with examples that illustrate the characteristics of effective graphical displays of data and provides solid techniques for producing graphs. Graphing Data begins with a discussion of what has been learned from the visual perception research that relates to graphing data. It then explores the analysis tasks that apply most often: the use of graphs for data summarization, the display of multiple units, ways to improve tabular displays, graphical alternatives to tables, two-variable scatterplots as graphical support for correlation and regression, how to show variation and summary statistics together, and how to create more effective legends and titles on graphical displays.
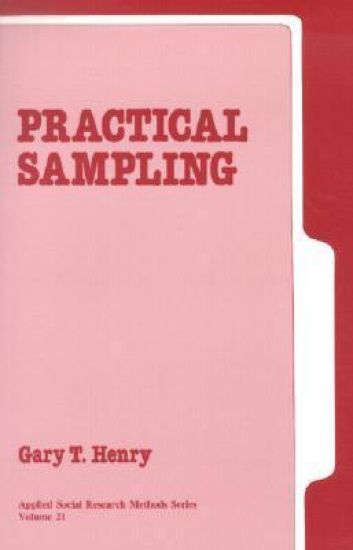
Sampling is fundamental to nearly every study in the social and policy sciences, yet clear, concise guidance for practitioners and graduate students has been difficult to find. Practical Sampling provides guidance for researchers dealing with the everyday problems of sampling. Using the practical design approach Henry integrates sampling into the overall research design and explains the interrelationships between research design and sampling choices. He lays out alternatives and implications of the choices using four detailed examples to illustrate the alternatives selected and the trade-offs made by applied researchers. The author uses a narrative, conceptual approach throughout the book; mathematical presentations are limited to necessary formulas; and calculations are kept to the absolute minimum, making it an easily approachable book for any researcher, student or professional across the social sciences.