Kirjojen hintavertailu – 12 859 819 kirjaa ja 27 kauppaa

Kirjailija

R. Dennis Cook

Kirjat ja teokset yhdessä paikassa: 5 kirjaa, julkaisuja vuosilta 1998–2024, suosituimpiin kuuluu Partial Least Squares Regression. Vertaile teosten hintoja ja tarkista saatavuus suomalaisista kirjakaupoista.

5 kirjaa

Kirjojen julkaisuvuodet: 1998–2024.

Partial Least Squares Regression

Partial Least Squares Regression

R. Dennis Cook; Liliana Forzani

TAYLOR FRANCIS LTD
2024
sidottu
Partial least squares (PLS) regression is, at its historical core, a black-box algorithmic method for dimension reduction and prediction based on an underlying linear relationship between a possibly vector-valued response and a number of predictors. Through envelopes, much more has been learned about PLS regression, resulting in a mass of information that allows an envelope bridge that takes PLS regression from a black-box algorithm to a core statistical paradigm based on objective function optimization and, more generally, connects the applied sciences and statistics in the context of PLS. This book focuses on developing this bridge. It also covers uses of PLS outside of linear regression, including discriminant analysis, non-linear regression, generalized linear models and dimension reduction generally. Key Features:• Showcases the first serviceable method for studying high-dimensional regressions.• Provides necessary background on PLS and its origin.• R and Python programs are available for nearly all methods discussed in the book. This book can be used as a reference and as a course supplement at the Master's level in Statistics and beyond. It will be of interest to both statisticians and applied scientists.

Applied Regression for Business and Economics

Applied Regression for Business and Economics

R. Dennis Cook; Bert Steece; Sanford Weisberg

John Wiley Sons Inc
2019
sidottu
1. Lack of competition in a growing market (i.e. business) 2. Authors' successful track records, both in books and in publications, and their unique blend of business and academic backgrounds 3. Use of computer techniques to visually and graphically display regression content 4. Intuitive vs. theoretical approach
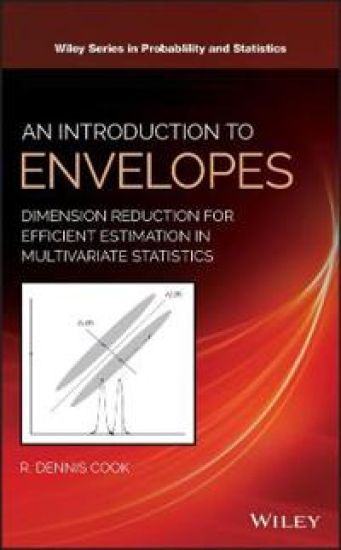
An Introduction to Envelopes

An Introduction to Envelopes

R. Dennis Cook

Wiley-Blackwell
2018
sidottu
Written by the leading expert in the field, this text reviews the major new developments in envelope models and methods An Introduction to Envelopes provides an overview of the theory and methods of envelopes, a class of procedures for increasing efficiency in multivariate analyses without altering traditional objectives. The author offers a balance between foundations and methodology by integrating illustrative examples that show how envelopes can be used in practice. He discusses how to use envelopes to target selected coefficients and explores predictor envelopes and their connection with partial least squares regression. The book reveals the potential for envelope methodology to improve estimation of a multivariate mean. The text also includes information on how envelopes can be used in generalized linear models, regressions with a matrix-valued response, and reviews work on sparse and Bayesian response envelopes. In addition, the text explores relationships between envelopes and other dimension reduction methods, including canonical correlations, reduced-rank regression, supervised singular value decomposition, sufficient dimension reduction, principal components, and principal fitted components. This important resource: • Offers a text written by the leading expert in this field • Describes groundbreaking work that puts the focus on this burgeoning area of study • Covers the important new developments in the field and highlights the most important directions • Discusses the underlying mathematics and linear algebra • Includes an online companion site with both R and Matlab support Written for researchers and graduate students in multivariate analysis and dimension reduction, as well as practitioners interested in statistical methodology, An Introduction to Envelopes offers the first book on the theory and methods of envelopes.
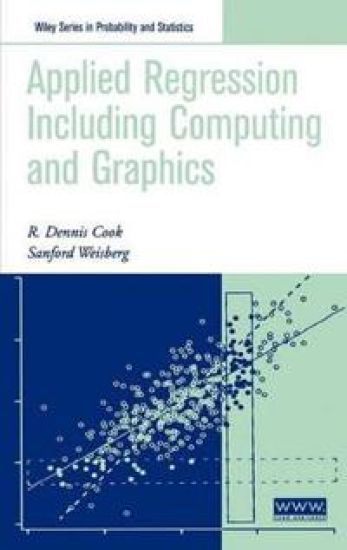
Applied Regression Including Computing and Graphics

Applied Regression Including Computing and Graphics

R. Dennis Cook; Sanford Weisberg

John Wiley Sons Inc
1999
sidottu
A step-by-step guide to computing and graphics in regression analysis In this unique book, leading statisticians Dennis Cook and Sanford Weisberg expertly blend regression fundamentals and cutting-edge graphical techniques. They combine and up- date most of the material from their widely used earlier work, An Introduction to Regression Graphics, and Weisberg's Applied Linear Regression; incorporate the latest in statistical graphics, computing, and regression models; and wind up with a modern, fully integrated approach to one of the most important tools of data analysis. In 23 concise, easy-to-digest chapters, the authors present:? A wealth of simple 2D and 3D graphical techniques, helping visualize results through graphs * An improved version of the user-friendly Arc software, which lets readers promptly implement new ideas * Complete coverage of regression models, including logistic regression and generalized linear models * More than 300 figures, easily reproducible on the computer * Numerous examples and problems based on real data * A companion Web site featuring free software and advice, available at www.wiley.com/mathem atics Accessible, self-contained, and fully referenced, Applied Regression Including Computing and Graphics assumes only a first course in basic statistical methods and provides a bona fide user manual for the Arc software. It is an invaluable resource for anyone interested in learning how to analyze regression problems with confidence and depth.
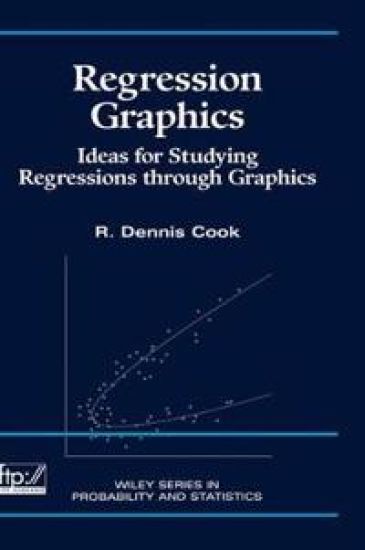
Regression Graphics

Regression Graphics

R. Dennis Cook

John Wiley Sons Inc
1998
sidottu
An exploration of regression graphics through computer graphics. Recent developments in computer technology have stimulated new and exciting uses for graphics in statistical analyses. Regression Graphics, one of the first graduate-level textbooks on the subject, demonstrates how statisticians, both theoretical and applied, can use these exciting innovations. After developing a relatively new regression context that requires few scope-limiting conditions, Regression Graphics guides readers through the process of analyzing regressions graphically and assessing and selecting models. This innovative reference makes use of a wide range of graphical tools, including 2D and 3D scatterplots, 3D binary response plots, and scatterplot matrices. Supplemented by a companion ftp site, it features numerous data sets and applied examples that are used to elucidate the theory. Other important features of this book include: *Extensive coverage of a relatively new regression context based on dimension-reduction subspaces and sufficient summary plots *Graphical regression, an iterative visualization process for constructing sufficient regression views *Graphics for regressions with a binary response *Graphics for model assessment, including residual plots *Net-effects plots for assessing predictor contributions *Graphics for predictor and response transformations *Inverse regression methods *Access to a Web site of supplemental plots, data sets, and 3D color displays. An ideal text for students in graduate-level courses on statistical analysis, Regression Graphics is also an excellent reference for professional statisticians.